Brazil voted on 4 October. Do the numbers add up?
Verdict: no statistical traces of manipulation
I ran standard election-forensics tests on the official section-level results of the 1st round of the presidential election of 4 October 2026, using the 2022 elections on the very same sections as a control. No test shows the signature of ballot-stuffing or result-painting. (Final TSE results; the runoff of 25 October 2026 is not covered.)
What happened on 4 October 2026
Brazil elected its president. Voting is compulsory and ballots are cast on electronic machines (urnas eletrônicas); the electoral authority TSE publishes final results per section — 499,248 of them, each covering a few hundred voters. Nobody crossed 50%, so the two leaders meet again in a runoff.
Result of the 1st round
Second round — 25 October 2026
Rest of the field
- Cury2.89%
- Ferreira2.24%
- Caiado2.18%
Turnout: 78.92%
- ballots cast125.3M
- registered voters158.7M
- blank + null votes4.8%
Three reasons the numbers can be trusted
The arithmetic is perfect
All 499,248 section records pass every self-consistency check with zero discrepancies: candidate votes + blank + null = ballots cast in each section, no section reports more votes than voters, and the national total matches the official result to the exact vote. Half a million machine-made records, perfectly consistent.
No anomalies where fraud would show
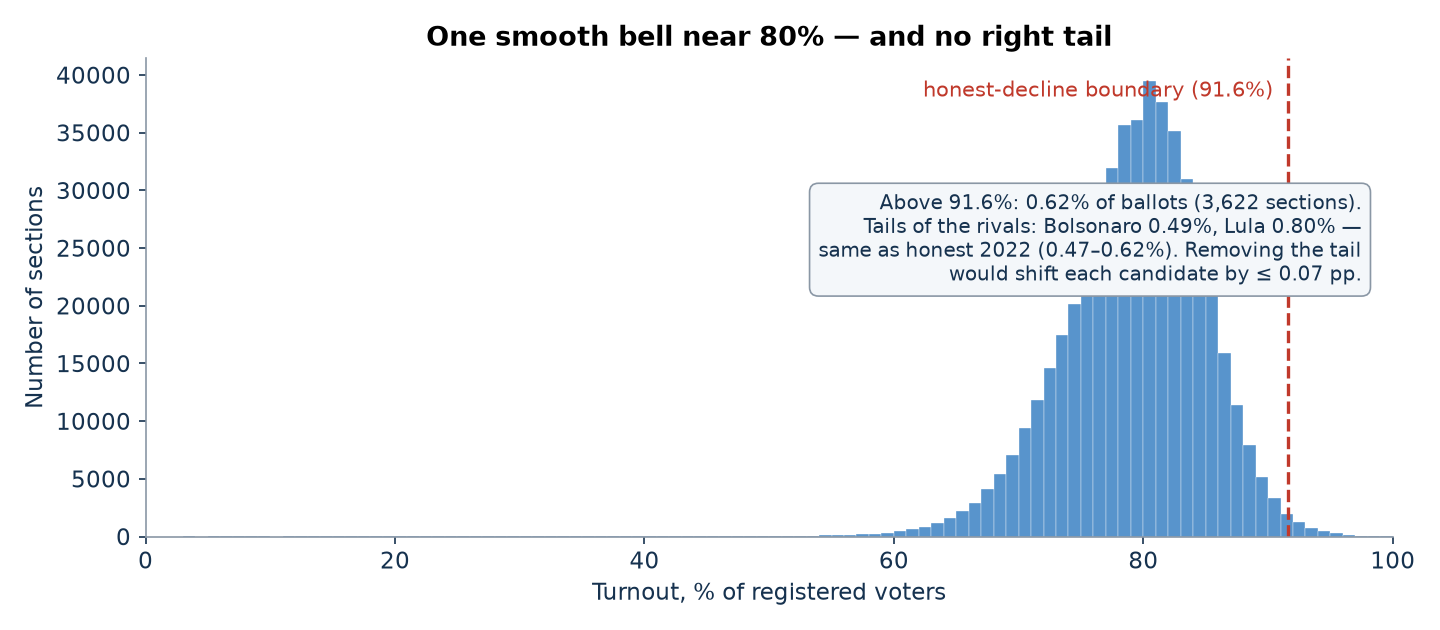
Section turnout is one smooth bell centred at ~81%. Above the 91.6% honest-decline boundary there is only 0.62% of ballots, and the tails of the two rivals are balanced (Bolsonaro 0.49%, Lula 0.80%). Deleting the whole tail would move each candidate by at most 0.07 points. No comet tail, no round-number peaks (|z| ≤ 1.3), no digit patterns, one duplicate pair in half a million sections.
It behaves exactly like the honest 2022 election
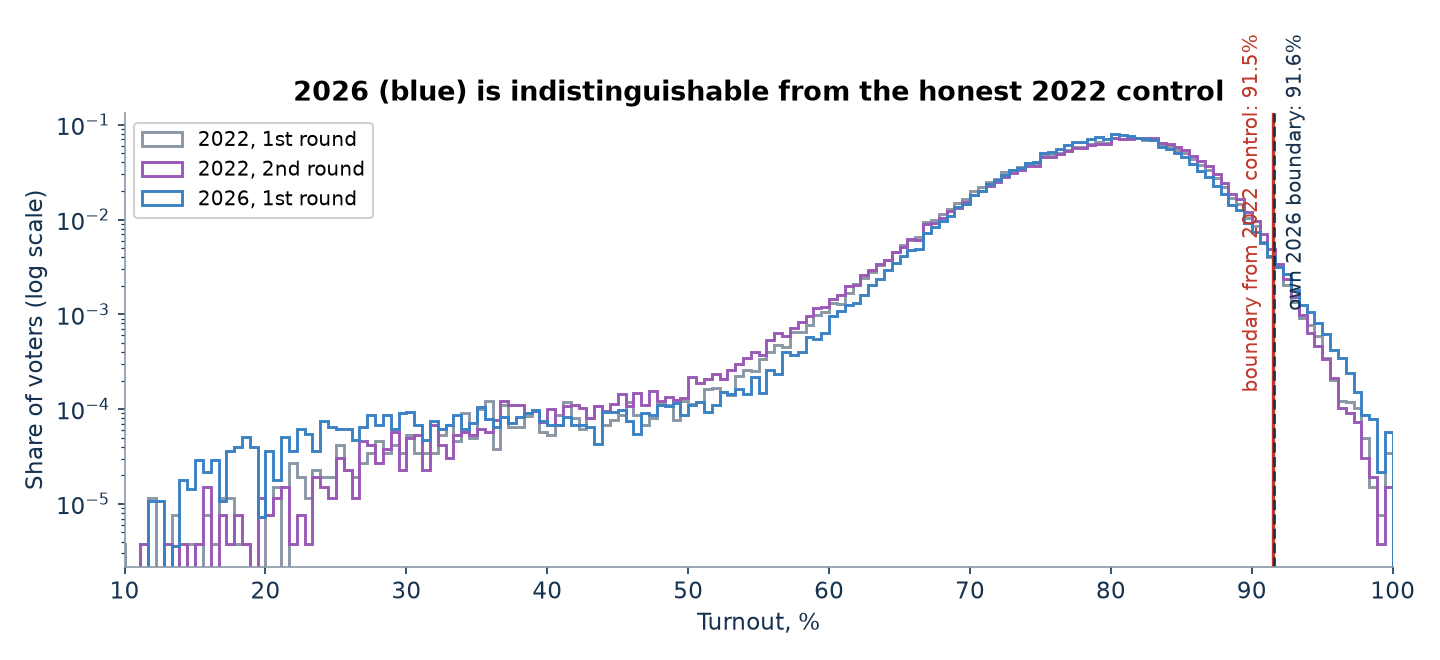
The 2022 presidential rounds on the same 461,218 sections serve as a control: the honest-decline boundary derived from them (91.5%) coincides with 2026's own (91.6%), and 2026's tails sit at 2022's own level (0.47–0.62%). Turnout jumps between 2022 and 2026 do not correlate with result swings (r ≈ 0.01), and the two-cluster “fingerprint” existed identically in honest 2022 — it is the Northeast/South geography, not fraud.
How I checked
Eleven families of tests used by election statisticians worldwide, run on the official section data with open-source code. Summary: all clean — and the toolkit demonstrably detects injected fraud.
Anomalous-vote estimate (Shpilkin method)
Votes beyond the honest turnout decline: 0.62% of ballots — at most 0.49% of Bolsonaro's and 0.80% of Lula's votes, and the tail is not tilted toward the leader (Lula's share at high turnout is slightly above his national one). Re-run separately for all five macro-regions plus abroad: no regional tail exceeds 0.85% of a candidate's votes.
Turnout × result scatter (“comet tail”)
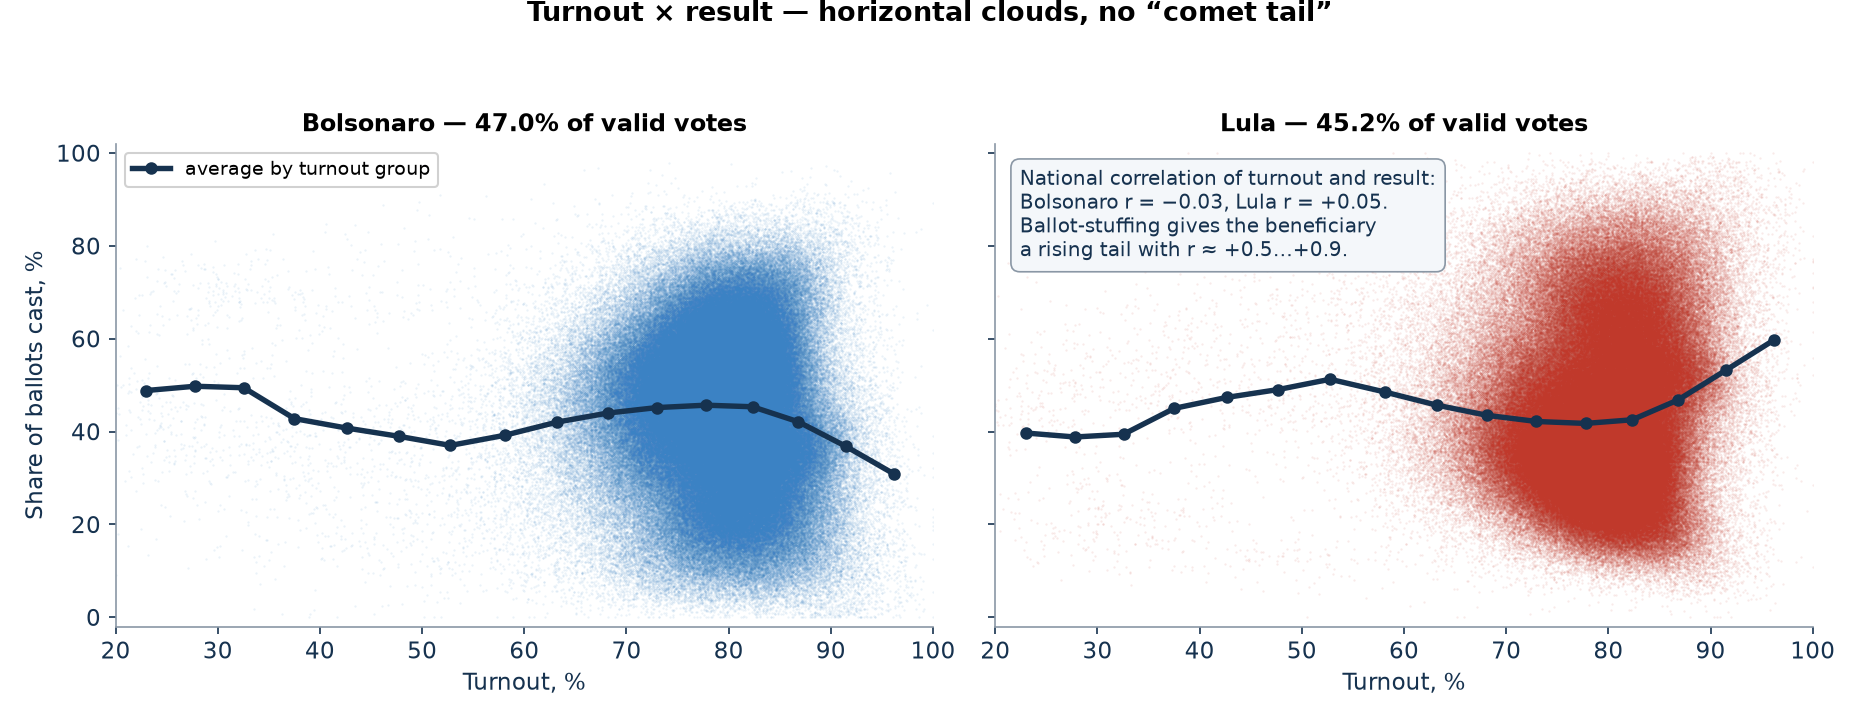
One horizontal cloud: national correlation −0.03 for the leader, +0.05 for the runner-up. The +0.5…+0.9 gradient that ballot-stuffing produces is absent.
Election fingerprints (Klimek et al.)
The statistical mixture splits into two clusters — but both at normal 78–80% turnout: the Northeast vs the South electorate split, mirrored for the two candidates. The fraud signature (a compact cluster at 90–100% turnout and 80–100% share) is absent in all 12 candidate × region runs.
Round-number peaks (Kobak et al.)
The share of sections with whole-percent turnout matches the size-adjusted random null (z = +0.5); for the leader's share z = −0.03. For comparison, in documented falsification cases z reaches dozens.
Benford's second digit
Formally “significant” — but the observed profiles are smooth monotone curves with no spikes on any digit, fully explained by minor candidates' tiny counters (mean under 10 votes per section). Fabricated numbers leave selective spikes; there are none. The test's null simply does not fit this data structure.
Last digit (Beber–Scacco)
Perfectly uniform over the full set of counts. After the standard ≥100 filter a mild 0.65-point gradient appears — a truncation artifact. The excess of “round” digits 0 and 5 is at most 0.12 points (~370 extra numbers out of 307,000).
2D correlations by state (Kobak et al.)
National r ≈ 0; by state from −0.30 to +0.49, exactly mirrored between the two candidates — mobilisation geography, symmetric, without the “one beneficiary wins at high turnout” signature.
Outliers vs neighbours, machine learning, duplicates
0.93% of sections flagged against their own municipality — the normal baseline for heavy-tailed distributions, tiny sections, no clustering; Isolation Forest's 1% is by construction. Exactly 1 duplicate result pair in 499,000 sections.
Voting-machine generations (urna models)
The recurring “old machines flip votes” claim: results across UE 2013–2022 machine generations differ by at most 1.8 points; the oldest machines lean to Lula, not to the leader, and are scattered across states rather than concentrated.
Control: the same sections in 2022
Boundary 91.5% (2022) ≈ 91.6% (2026); tails at the level of honest 2022; turnout jumps between the elections do not correlate with share swings (r ≈ 0.01, the leader's swing uniform across all ten jump deciles); the two-cluster fingerprint reproduces unchanged from 2022.
Self-test: the toolkit actually detects fraud
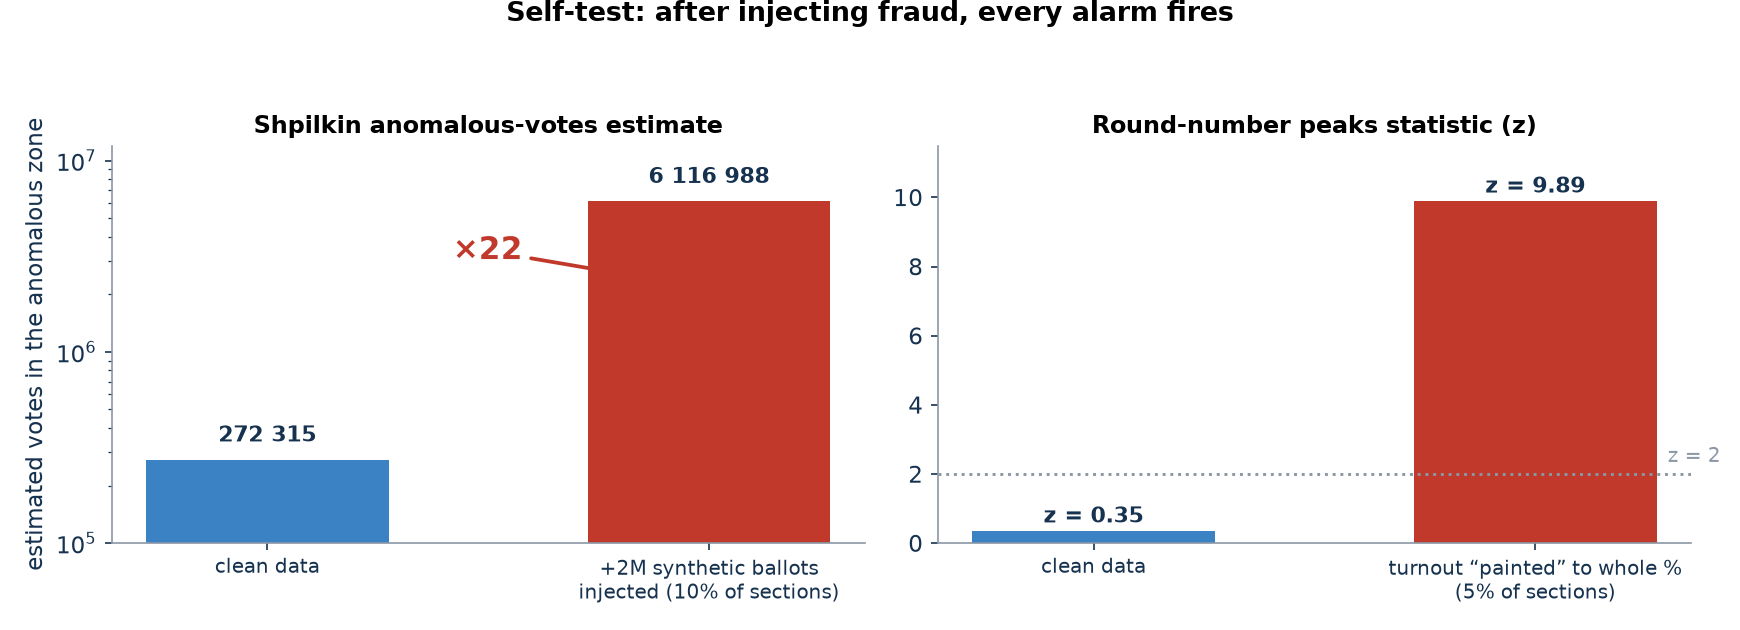
Injecting 2 million synthetic ballots grows the estimated anomalous zone 22-fold; painting turnout to whole percentages in 5% of sections pushes z to 9.9. On these data the methods are sensitive enough to see fraud of this scale — the clean verdict is not a blind spot.
What this analysis cannot see
Honest limits of the method — statistics shows anomalies, not intentions.
- Counting is electronic: for “protocol” tests (round numbers, digits) the null is a machine, not a person with a calculator. A tampering path at the level of result transmission would leave other traces (ballot-unit ↔ tally reconciliations) that are not part of the open dataset.
- Regional heterogeneity is huge (Lula 60.5% in the Northeast vs 30.1% in the South). The key tests were therefore re-run stratified by macro-region and by state, and outliers were measured against neighbours within the same municipality; residual state-level heterogeneity remains but carries no fraud signature.
- Only the 1st round is analysed. The runoff (Bolsonaro × Lula, 25 October 2026) will be added once TSE publishes its final section-level results.
- The 2022 match covers 92.4% of 2026 sections (93.3% of voters); new or renumbered sections are covered by the national and stratified tests only. Abroad, sections are renumbered between elections, so the jump test is not interpreted there.
- Section-level forensics cannot see manipulation above the section level (e.g. rewriting during aggregation); such checks require ballot-unit ↔ totalizer files that are not published in the open dataset.
- I am an independent researcher with no ties to the electoral authority or any campaign; all inputs are official TSE publications and the analysis code is open source.
Data & reproducibility
- Source: official section-level (seção) results from the TSE open-data portal (resultados-2026), final 1st-round files generated 5–6 October 2026: 499,248 sections including abroad voting — about 23 GB of CSV.
- Self-consistency: zero discrepancies in all checks (nominal votes vs detail files, blank/null cross-checks, no duplicated section keys, no turnout above electorate); the national total matches the official result to the exact vote. Control dataset: TSE resultados-2022, both rounds, matched to the same sections (92.4% coverage).
- Toolkit: open-source election-forensics pipeline (Python, pandas / scikit-learn) implementing Shpilkin, Klimek, Kobak, Beber–Scacco, neighbour-outlier and Isolation-Forest methods, urna-model stratification, the 2022 control and synthetic self-tests.
- Full technical report (in Russian), the section dataset, scripts and all 18 figures / 21 tables are available in the project repository.