Portugal voted on 18 May 2025. Do the numbers add up?
Verdict: no statistical traces of manipulation
I ran standard election-forensics tests on the official parish-level results of the 18 May 2025 legislative election — and, as an addendum, on the precinct protocols of six municipalities that publish them. Every applicable test is consistent with an honest count.
What was decided on 18 May 2025
Snap election for the Assembly of the Republic (230 seats). The centre-right coalition AD won 32.7%, ahead of the Socialist Party (23.4%) and Chega (22.6%). National turnout: 64.4% — 5.97 million ballots cast.
National result — 3,092 parishes (overseas circle excluded)
The overseas circle (~1.6 million registered voters) is not part of the parish-level official export; percentages above are shares of ballots cast.
Three reasons the numbers can be trusted
The high-turnout zone is physically empty
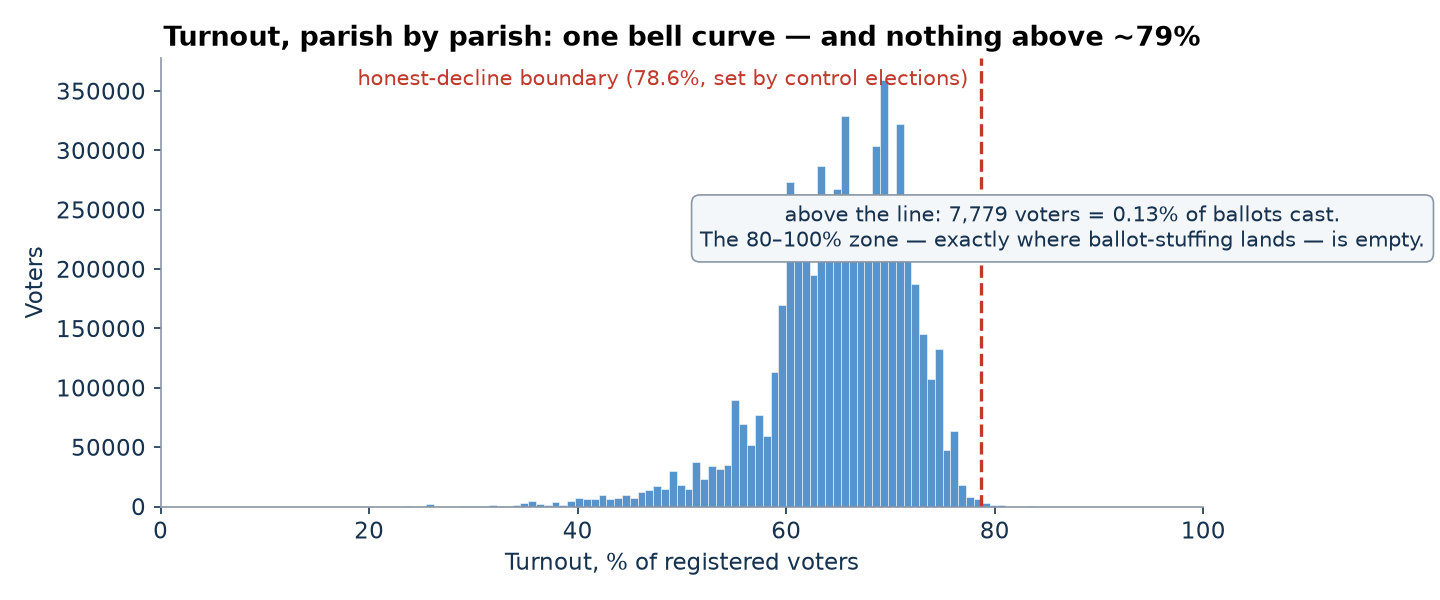
Parish turnout forms one bell curve that fades out by ~79%. Above the 78.6% boundary — the upper percentile of the 2022 and 2024 control elections — only 7,779 voters remain: 0.13% of ballots. Ballot-stuffing shifts mass precisely into the 80–100% zone; here that zone contains essentially nothing, and the same ~78–80% ceiling recurred in 2022 and 2024.
The leader’s result does not grow with turnout
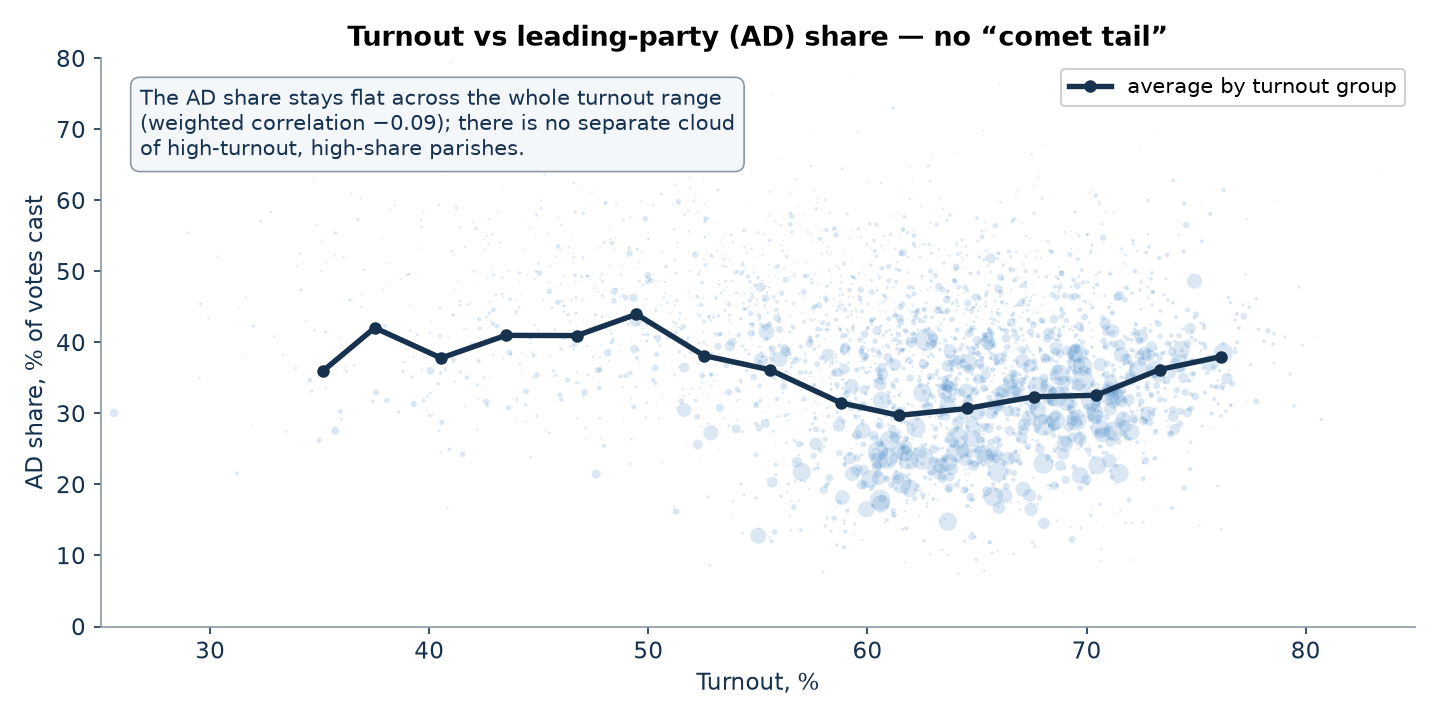
In the turnout × result scatter, the AD cloud stays vertically compact across the whole range (weighted correlation −0.09), and the fingerprint analysis finds no “up-right” cluster. The two clusters it does find are geography — the rural north versus the south and the cities — not fraud.
Every flagged oddity is tiny — and the toolkit provably works
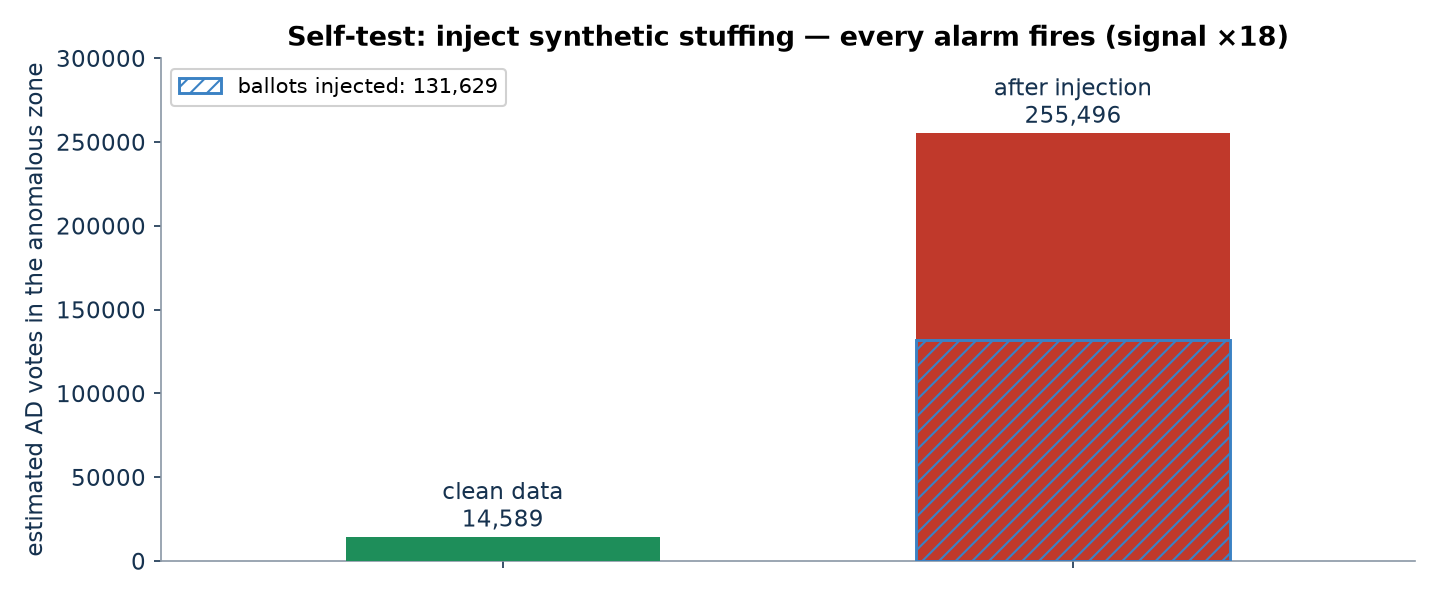
The 81 neighbour-outliers and 31 machine-learning anomalies are minute parishes with mixed directions — the most extreme is a parish with an anomalously LOW AD share. In the self-test, injecting 131,629 synthetic ballots grew the anomalous-zone estimate 18-fold and pushed the round-number statistic from z = 0.2 to 5.1: the “clean” verdict is a measurement, not a blind spot.
How I checked
Ten families of tests used by election statisticians worldwide, run on the official parish data with open-source code. Summary: all clean.
Anomalous-vote estimate (Shpilkin method)
Beyond the honest decline: 2,980 AD votes = 0.15% of the party’s votes. Recounting without that zone moves the result from 32.72% to 32.71%.
Turnout × result scatter (“comet tail”)
A continuous cloud with no “tail” of high-turnout, high-AD parishes — the signature ballot-stuffing produces.
Election fingerprints (Klimek et al.)
The distribution matches honest elections; the 2D cluster typical of fraud (80–100% turnout with a high share) is absent. The clusters that do exist track geography.
Round-number peaks (Kobak et al.)
Parishes with exactly whole-percentage turnout: 1.46% vs 1.44% expected by chance (z = 0.1); no excess of multiples of 5, none in the leader’s share either (z between −0.4 and +0.1).
Digit tests (Benford, last digit)
12 tests on vote counts: 11 clean. The only borderline value — AD, last digit, p = 0.02 (a deficit of digit 4) — has no “invented numbers” profile and is not significant after multiple-testing correction.
Outliers vs neighbours
81 of 3,092 parishes (2.6%) beyond |z| > 4 — small parishes, mixed directions, no clustering at high turnout.
Jumps versus the 2024 election
Not a single parish shows a simultaneous jump in turnout and in AD share above 15 points.
Machine learning (Isolation Forest)
31 anomalies (top 1% by construction): tiny Azorean and mountain parishes with high blank-ballot shares; no suspicious clustering.
Precinct protocols cross-checked against official totals
In six municipalities that publish precinct maps (91 precincts, 60,711 registered voters = 0.66% of the electorate), the precinct sums match the official totals of every list to the exact vote; the row arithmetic is exact; no duplicated protocols.
Self-test: the toolkit actually detects fraud
Synthetic stuffing injections fire every alarm (Shpilkin signal ×18; round-number z 0.2 → 5.1). The “clean” verdict is a real measurement.
What this analysis cannot see
Honest limits of the method — statistics shows anomalies, not intentions.
- The national analysis level is the parish: the Interior Ministry portal does not publish precinct-level results. The precinct check covers six municipalities (0.66% of the electorate); at that scale, the self-test shows the round-number test cannot detect redrawing of ~9% of protocols.
- The overseas electorate (~1.6 million registered voters) is excluded — it is not part of the parish-level official export.
- The Shpilkin method estimates magnitude under model assumptions; the anomaly boundary comes from the 2022/2024 control elections, not only from the shape of the distribution.
- Digit tests are weak; the single borderline deviation (AD, p = 0.02) has no fraud profile and does not survive multiple-testing correction.
- Statistics can confirm the numbers are mutually consistent; it cannot substitute documentary evidence (minutes, witnesses) or reveal mechanisms.
- I am an independent researcher with no ties to any electoral body; all input files are official publications of the Portuguese authorities, and the analysis code is open source.
Data & reproducibility
- Source: official results portal of the Ministry of Internal Administration at eleicoes.mai.gov.pt — parish-level export, 3,092 territories (mainland, Madeira, Azores).
- Cross-checks: parish sums close exactly against the national totals; the precinct sums of the six publishing municipalities match the official totals to the exact vote.
- Toolkit: open-source election-forensics pipeline (Python, pandas / scikit-learn) implementing Shpilkin, Klimek, Kobak, Beber–Scacco and other methods.
- Full technical report (in Russian), data files and scripts are available in the project repository.